ANALYSIS FIRST QUARTER 2020
Context
The underlying LVS account in Darwinex has closed the first quarter of the year with a loss of -18.25% (including floating P/L). Despite being a report on the first quarter, we will focus the analysis on the last month. The situation generated with COVID-19 is exceptional and we want to comment on everything we have experienced. This is probably a historical moment where, after years of bull market, the stocks have collapsed at an impressive speed losing up to 40-45% from highs. All of this is due to the uncertainty of coronavirus pandemic and its economic consequences. There is great consensus among economists that a great part of the world will fall into recession this year. Now we will see the effectiveness of the measures that are being taken by states and central banks in order to recover the economy as soon as possible.
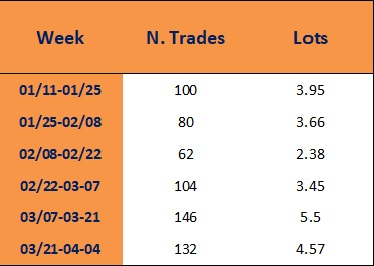
In this context, our portfolio is working in completely unknown market conditions until now. With bank rates virtually at 0% in the main economic areas and with an almost certain recession, the portfolio has suffered the sudden changes in market conditions. The week of March 9th began with a negative gap due to tensions over the price of crude. During that week the portfolio began to react trying to take advantage of the new volatility situation. The extreme movements experienced in currencies such as AUD, NZD or JPY have caused that some trades had extremely wide stop loss. Due to this, few trades has produced losses much larger than usual. For example, the EURAUD has moved 1800 pips in 1 day. Unfortunately, the last week of March the portfolio has been penalized especially in pairs related with Canadian Dollar. Trading volume has also increased substantially over previous months doubling the number of transactions compared to biweekly average.
Here is a table to check this change with intervals of 15 days:
Below you can see the table corresponding to each cross negotiated by volume:

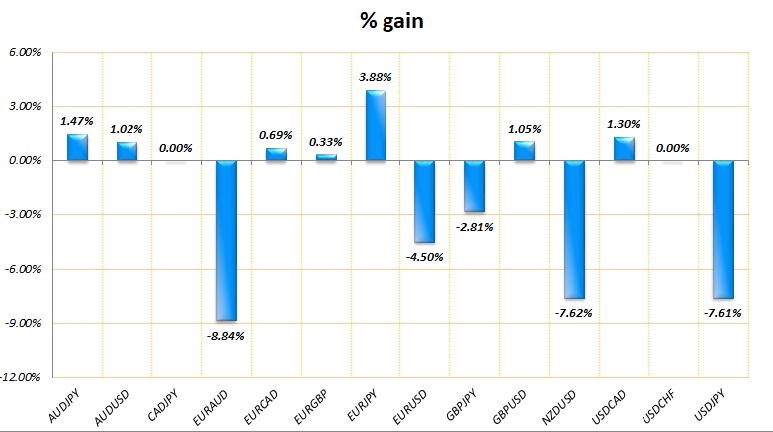
Next is the chart that represents quarterly profits/losses of each FX pair in the underlying account. As you can see, the losses are concentrated mainly in three specific crosses:
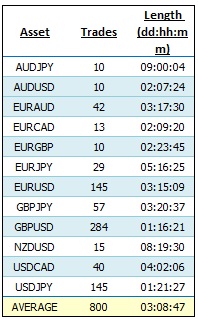
Below you will find the table detailing the number of trades and the average duration of each FX pair during this quarter. The overall duration has been quite similar to the previous quarter:
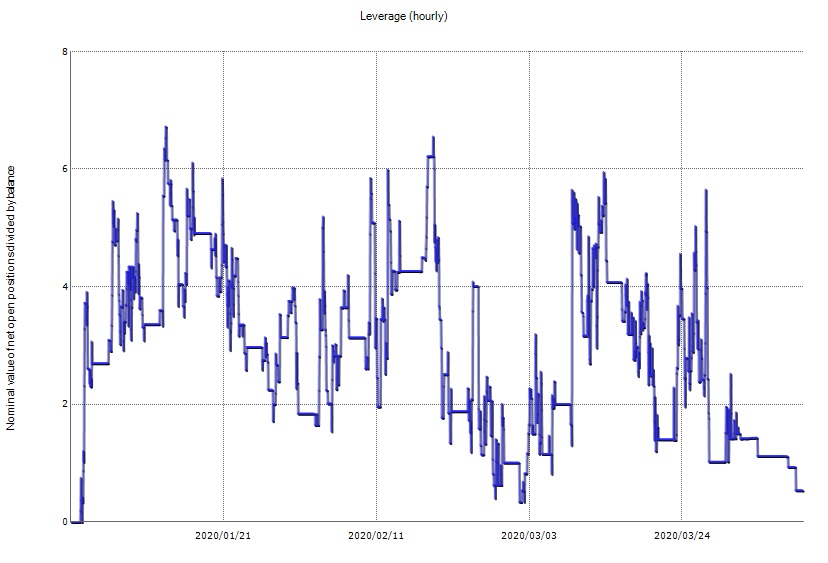
We also want to show the leverage used in this quarter, which has also remained under control in recent weeks despite the increase of traded lots:
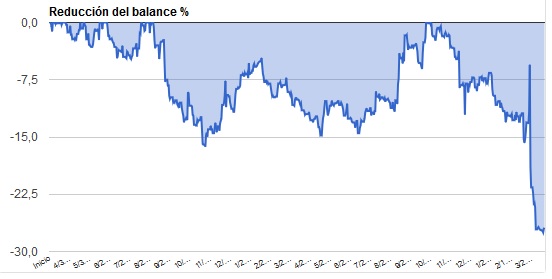
We finish with the drawdown graph. The negative result of this month has caused us to be at the maximum historical drawdown. You can clearly see the sudden drop in recent weeks:
The VaR of darwin LVS has also increased from 5% to 11%. A rebound that we consider totally normal given the rise of negotiated volume.
Trading view and what to expect in the coming weeks
The first quarter has been very bad. Bad trades are very concentrated and we will review where is necessary to fix certain parameters.
At operational level, we started April with just a few open trades and we have implemented some additional measures to avoid excess of leverage and over-exposure to a specific currency. In addition, we have implemented a control measure on trades with very wide SL that increase the risk per trade unnecessarily.
We think high volatility will be maintained for some time but with some breaks. Our systems in this context will be very active with VaR values and leverage above the average.
We will also monitor the VaR of the account to keep it in the range of 5% – 10% so that the replica on the darwin is as similar as possible.
Finally, we want to thank all our investors for their trust in LVS and for sharing our “LONG VISION” philosophy. We will double our efforts to obtain more consistent results to the trust placed in us.
Sincerely,
Feycox Development S.L.